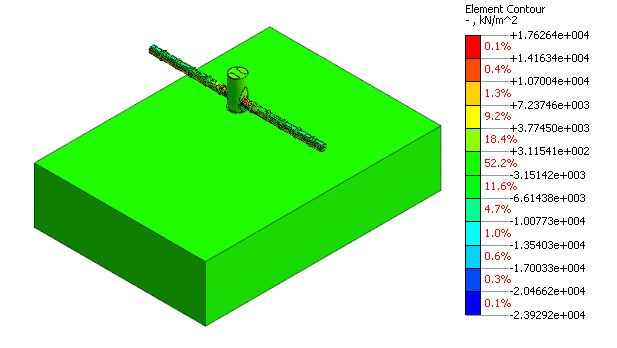
Others

Element Contour Plot

Print different element result types on the screen.


Specify the result set and step, and select the element type and element results to print.


<Simultaneous representation of ground stress and plate stress>


Convert to Decibel

 - Dynamic analysis result (Displacement, Velocity, Acceleration) Decibel auto conversion

Convert the displacement, velocity and acceleration to Decibel (dB) form and display it as a table.

Select the node after specifying the analysis set/step/result and input the reference value to convert the displacement, velocity and acceleration at that node to Decibels (dB).

IMG_C_ICON_NOTE_01.png

Vibration levels generally use g (acceleration) or g2 values, while the dB (decibel) is widely used. This is because when noise or vibration occurs, the physical quantity range humans can feel is very wide and so, it is inappropriate to express this physical quantity using a linear scale.

The decibel (dB) is expressed using a ratio between the physical quantity X and the reference physical quantity Xref, plotted as a common log function.

Here, when the reference physical quantity is 20μPa for sound pressure, the acceleration is in μm/s2 (KS, JIS). The 20μPa is a subjective reference that is expressed as “the minimum sound pressure an average healthy human can hear”


[Decibel Reference Levels (ISO R 1683)]

Quantity

Definition

Ref. level

Amplitude Rations

Vibratory Acc. Level

La = 20 log10 (a/a0) dB

a0 = 10-6 m/s2

Vibratory Vel. Level

Lv = 20 log10 (v/v0) dB

v0 = 10-9 m/s

Vibratory Dis. level

LF = 20 log10 (d/d0) dB

d0 = 10-12 m


3D-2D Wizard

When checking the results after 3D analysis, use the cut section & clipping function to check the arbitrary section result contours. Here, for the cut arbitrary section, the analysis results such as the minimum, maximum, absolute maximum value etc. can be checked along with the position. Because all results from the FEM analysis is calculated with reference to the element nodes, when a cut arbitrary section passes through the interior of the solid element, the results from nearby nodes are automatically interpolated and output.
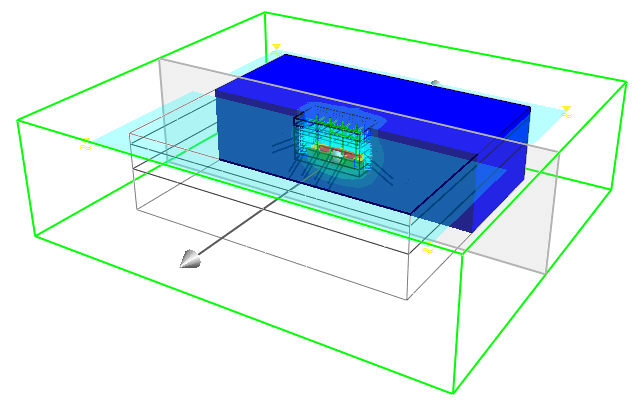
<3D-2D Wizard (Result output on arbitrary section)>


The result tag from the specified arbitrary section is output following the process outlined below.


1. Add the arbitrary section where the results will be checked, from Additional view control toolset > View cut model (Cut section & Clipping). As many cut sections as desired can be added in the GCS axis direction, or in the arbitrary section direction.


<Cut section & Clipping (Specify arbitrary section)>


2. Choose Result analysis > Advanced > Others > 3D-2D Wizard.

Check the [Show Points] option to display all nodes on an arbitrary section where the results can be output.  

Like the result value tag, select the nodes or elements to check the numerical value, along with the positions of the minimum, maximum, absolute maximum values on the viewed section.


Mdoal Damping Ratio

Eigenvalue analysis provides damping ratios for each mode based on the strain energy of the structure. This can be used to obtain modal damping ratios in the structure with different materials or damping devices.