|
 Setting the diagram properties Setting the diagram properties
Specify the display settings for a 1D element result diagram.
Diagram > Scale Factor
Plot the scaled member force or stress diagram of a 1D element.
Diagram > Line Width
Plot the scaled Diagram line thickness.
Diagram > Diagram Type
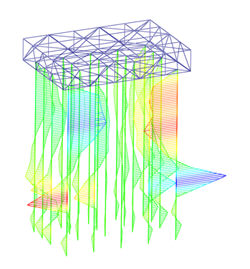
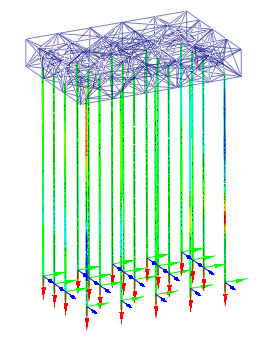
Select the diagram type that reflects the analysis results, using contours or a single color, and plot.
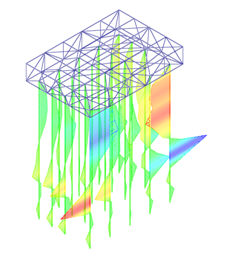 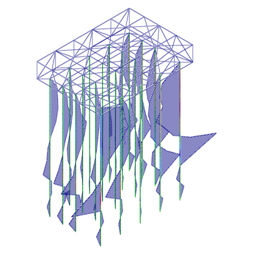
<Contour> <Single color>
Diagram > Diagram Color
Define the color for the single color type diagram.
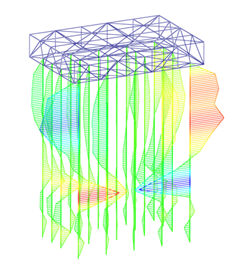
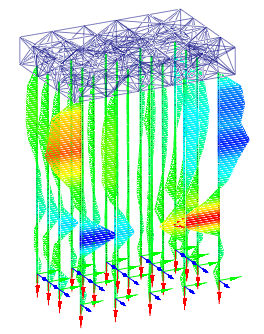
Diagram > Fill Type
Plot the diagram using a fill type; either a line fill or solid fill.
 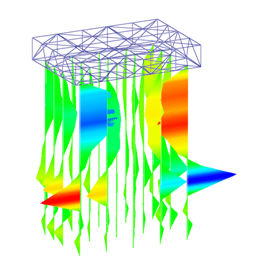
<Line fill> <Solid fill>
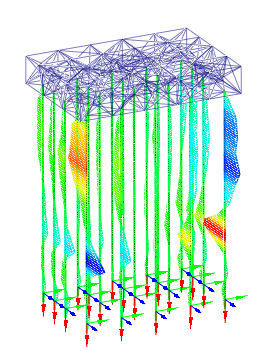
Diagram > Reverse
Reverse the direction of the diagram display and plot.
<Reverse(True)> <Revers(False)>
Diagram > Reference Value
Determine whether to display the diagram using a relative value, with respect to the reference value.
Diagram > Result Direction
Set the diagram display direction with reference to the element coordinate axis or GCS, and plot.
<Element X direction> <Element Y direction> <Element Z direction>
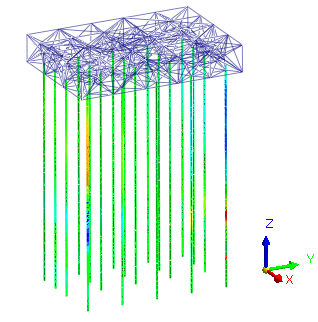  
<GCS X direction> <GCS Y direction> <GCS Z direction>
Division
Determine the number of divisions there will be on the diagram for representation.
|