|
Result
-
The analysis results are output in a graph or table for each depth.
-
Converging results and table (Absolute) (Maximum acceleration, Maximum velocity, Maximum displacement)
-
Converging results and table (Relation) (Maximum acceleration, Maximum velocity, Maximum displacement)
-
Strain/Stress result table (Uniform strain, Maximum strain, Maximum shear strain)
-
Soil profile result table (Converging damping ratio, Converging shear modulus, Shear modulus ratio)
-
Soil profile table (Shear wave velocity, Shear modulus, Damping ratio)
Result : Time History Result
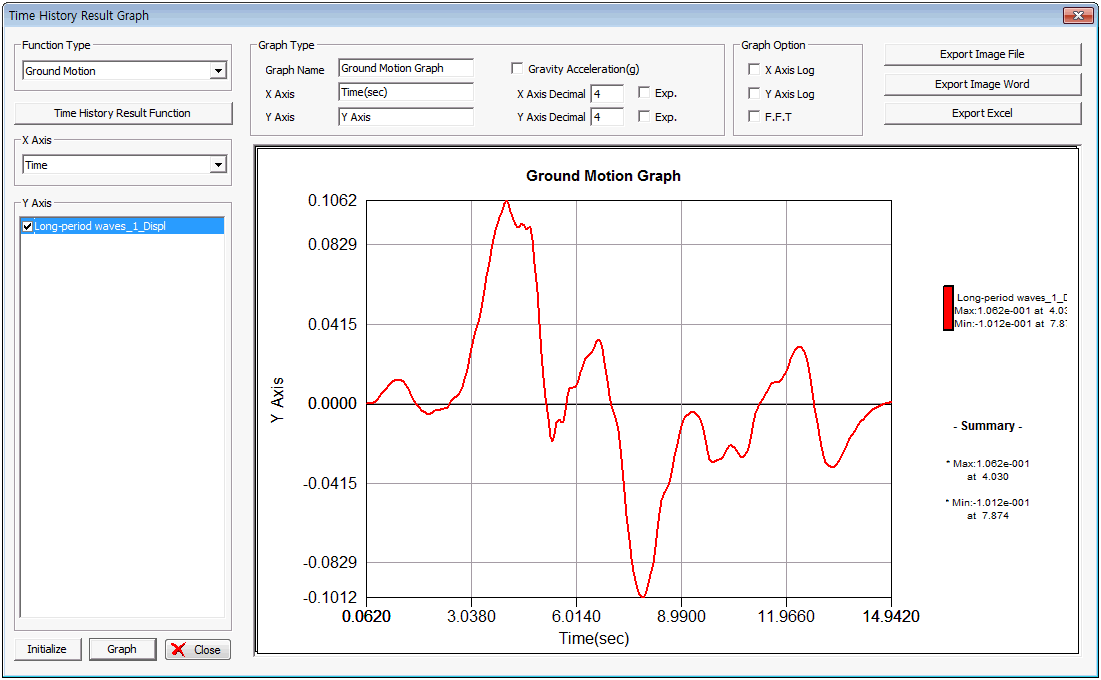
Select the function type of the output graph. The function types are ground movement, response spectrum, stress/strain, and transfer function.

[Time History Result Function]
Select the function data, strata, result type of the output graph. Each result type can be selected depending on the ground movement result function type.
|
round Motion Result Function Type
|
Result type
|
|
Ground Motion
|
Displacement, Velocity, Acceleration, Relative displacement, Relative Velocity, Relative acceleration
|
|
Response Spectrum
|
Relative displacement, Relative pseudo-velocity, Relative velocity, Absolute pseudo-acceleration, Absolute acceleration
|
|
Stress/Strain
|
Stress, Strain
|
|
Transfer Function
|
Transfer function
|
The selected result function is registered on the y axis.
The graph name, x axis name and y axis name can be defined for the time history graph in Define Graph, and the values can also be expressed in exponential form.
The x axis, y axis can be represented in log scale or the F.F.T can be set in Graph Options.
The generated graph is displayed in the dialog window and can be exported in many forms such as image file, image word file or excel file.
|
